Replacement Server Monitoring – Part 1: Picking a Replacement
As a company primarily dealing with Linux servers and keeping them online constantly, here at Dogsbody we take a huge interest in the current status of any and all servers we’re responsible for. Having accurate and up to date information allows us to move proactively and remedy potential problems before they became service-impacting for our customers.
For many years, and as long as I have worked at the company, we’d used an offering from New Relic, called simply “Servers”. In 2017, New Relic announced that they would be discontinuing their “Servers” offering, with their “Infrastructure” product taking it’s place. The pricing for New Relic infrastructure was exorbitant for our use case, and there were a few things we wanted from our monitoring solution that New Relic didn’t offer, so being the tinkerers that we are, we decided to implement our own.
This is a 3 part series of blog posts about picking a replacement monitoring solution, getting it running and ready, and finally moving our customers over to it.
What we needed from our new solution
The phase one objective for this project was rather simple: to replicate the core functionality offered by New Relic. This meant that the following items were considered crucial:
- Configurable alert policies – All servers are different. Being able to tweak the thresholds for alerts depending on the server was very important to us. Nobody likes false alarms, especially not in the middle of the night!
- Historical data – Being able to view system metrics at a given timestamp is of huge help when investigating problems that have occurred in the past
- Easy to install and lightweight server-side software – As we’d be needing to install the monitoring tool on hundreds of servers, some with very low resources, we needed to ensure that this was a breeze to configure and as slim as possible
- Webhook support for alerts – Our alerting process is built around having alerts from various different monitoring tools report to a single endpoint where we handle the alerting with custom logic. Flexibility in ours alerts was a must-have
Solutions we considered
A quick Google for “linux server monitoring” returns a lot of results. The first round of investigations essentially consisted of checking out the ones we’d heard about and reading up on what they had to offer. Anything of note got recorded for later reference, including any solutions that we knew would not be suitable for whatever reason. It didn’t take very long for a short list of “big players” to present themselves. Now, this is not to say that we discounted any solutions on the account of them being small, but we did want a solution that was gonna be stable and widely supported from the get-go. We wanted to get on with using the software, instead of spending time getting it to install/run.
The big names were Nagios, Zabbix, Prometheus, and Influx (TICK).
After much reading of the available documentation, performing some test installations (some successful, some very much not), and having a general play with each of them, I decided to look further at the TICK stack from InfluxData. I wont go too much into the negatives of the failed candidates, but the main points across them were:
- Complex installation and/or management of central server
- Poor / convoluted documentation
- Lack of repositories for agent installation
Influx (TICK)
The monitoring solution offered by Influx consists of 4 parts, each of which can be installed independently of one another
TTelegraf – Agent for collecting and reporting system metrics
IInfluxDB – Database to store metrics
CChronograf – Management and graphing interface for the rest of the stack
KKapacitor – Data processing and alerting engine
Package repositories existed for all parts of the stack, most importantly for Telegraf which would be going on customer systems. This allowed for easy installation, updating, and removal of any of the components.
One of the biggest advantages for InfluxDB was the very simple installation: add the repo, install the package, start the software. At this point Influx was ready to accept metrics reported from a server running Telegraf (or anything else for that matter. There were many clients that support reporting to InfluxDB, which was another positive)
In the same vein, the Telegraf installation was also very easy, using the same steps as above, with the additional step of updating the config to tell the software where to report it’s metrics too. This is a one-line change in the config, followed by a quick restart of the software.
At this point we had basically all of the system information we could ever need, in an easy to access format, only a few seconds after things happen. Awesome.
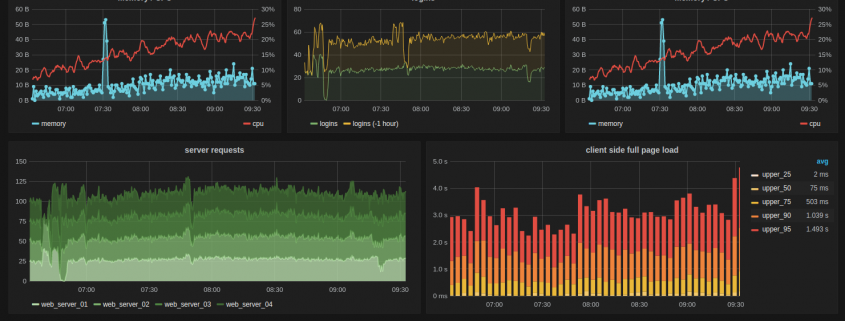
Although the most important functionality to replicate was the alerting, the next thing we installed and focused on was the visualisation of the data Telegraf was reporting into InfluxDB. We needed to ensure the data we were receiving mirrored what we were seeing in New Relic, and it can also be tricky to create test alerts when you have no visibility of the data you’re alerting against too, so we needed some graphs (everyone loves pretty graphs as well of course!)
As mentioned above, Chronograf is the component of the TICK stack responsible for data visualisation, and also allows you to interface with InfluxDB and Kapacitor, to run queries and create alerts, respectively.
In summary, the TICK stack offered us an open source, modular and easy to use system. It felt pleasant to use, the documentation was reasonable, and the system seemed very stable. We had a great base, one which we could design and build our new server monitoring system. Exciting!
Replacement Server Monitoring
- Part 1: Picking a Replacement (you are here)
- Part 2: Building the replacement
- Part 3: Kapacitor alerts and going live!


Trackbacks & Pingbacks
[…] office which shows the current status of the servers we manage. Most of our customers are using our new alerting stack, but some have their own monitoring solutions which we want to integrate with. One of these was […]
[…] we record all server resource metrics every 10 seconds onto our MINDER stack and alerts will be raised will in advance of disk space running out. You don’t need to be […]
[…] far in this series of blog posts we’ve discussed picking a replacement monitoring solution and getting it up and running. This instalment will cover setting up the actual alerting rules for […]
[…] our last post we discussed our need for a replacement monitoring system and our pick for the software stack we […]
Leave a Reply
Want to join the discussion?Feel free to contribute!